
GLP-1 Plotter: Chart Your Medication Level & Weight Over Time

This article is for general informational purposes only and is not a substitute for professional medical advice, diagnosis, or treatment. Always consult a qualified healthcare provider with questions about a medical condition.
Quick answer
A GLP-1 plotter charts your medication level between weekly doses, your weight-trend curve, and your dose timeline — so you can see the whole picture, not one number.
A weight number on one morning tells you almost nothing.
A GLP-1 like Wegovy, Ozempic, Zepbound or Mounjaro works over months, its level in your body rises and falls between weekly shots, and your weight comes off in an uneven, plateau-punctuated line.
A plotter — the graph view of your journey — turns those scattered data points into curves you can actually read.
This page explains what a GLP-1 plotter plots and how to read it, without over-interpreting it.
A plotter is different from a plain dose tracker, which logs what mg you took and when, and from a progress tracker, which follows your weight and measurements.
The plotter is the visualization layer on top of both — it takes your logged doses and weigh-ins and draws them as lines.
For the full picture of everything worth logging, start at the GLP-1 tracker app hub.
01
The three curves a GLP-1 plotter draws
A useful plotter overlays three things on one timeline:
- 1
The medication-level curve
a conceptual line showing your drug level climbing after each shot and tapering before the next.
- 2
The weight-trend curve
your weigh-ins smoothed into a trend line, so daily noise disappears.
- 3
The dose timeline
a marker each time your titration steps up, laid under the other two so you can see cause and effect.
The point of putting them on one chart is relationship: you can see how a dose step-up sits against a whoosh of weight loss, or against a rough week of side effects.
02
The medication-level curve: peaks, troughs and half-life
The most misunderstood curve is the medication level. Here is the intuition, kept educational: after a subcutaneous shot, the drug rises to a peak, then falls as your body clears it.
How fast it falls is governed by the drug's half-life — the time for the level to drop by half.
Semaglutide has a half-life of about one week (roughly 7 days), with the peak blood level reached 1–3 days after a dose, per the FDA Ozempic label.
Tirzepatide's half-life is about 5 days. Those long half-lives are exactly why these are once-weekly injections: the level never fully washes out between shots.
A plotter draws this as a gently rising-and-falling wave — a small peak a couple of days after each shot, a small trough right before the next one. Important: this is a model built from population averages, not a reading of your blood.
It is a way to build intuition ("levels don't crash to zero between shots"), never a basis for timing a dose or deciding you feel a "trough." Those decisions belong to your prescriber.

03
Why weekly dosing makes a nearly flat line
Because the half-life is long relative to the 7-day gap, each shot lands before the previous one has cleared.
Over the first few weeks the level therefore climbs to a steady state — a stable band it oscillates within — reached after roughly 4–5 weeks of consistent weekly semaglutide dosing.
On the plotter this looks like a wave that starts low, steps up with each early dose, then settles into a steady ripple.
Seeing that flattening is reassuring: it is the graph of your medication becoming consistent.
Every time your dose is increased on your titration schedule, the plotter shows the band step up to a new, higher steady level over the following weeks — which is also when side effects tend to cluster.
04
The weight-trend curve: reading a non-linear line
Weight is the headline, but day-to-day it is dominated by water, food and hormones. Plotted raw it is a jagged mess; plotted as a trend line it tells the truth. Two features matter:
- Plateaus are normal. Flat stretches of two to four weeks are common and medically explainable — metabolic adaptation, small intake creep, or muscle loss. On a plotter a plateau is a visible shelf, not a failure.
- Whooshes happen. Weight sometimes holds then drops suddenly. A trend line captures the underlying direction that a single weigh-in hides.
The value of plotting weight against the dose timeline is that you stop reacting to one bad morning and start reading the multi-week slope.

05
How to read your plot without over-reading it
A plotter is a thinking tool, not an oracle. Three guardrails:
The medication curve is conceptual, not personal.
It will not tell you your real drug level or when to inject.
Zoom out.
Judge weight on 4-week windows, not day to day.
Bring it to your clinician, don't act on it alone.
A clean chart makes an appointment more productive; it never replaces one.
06
How to build a GLP-1 plot in 5 steps
- Log every shot with its date and mg — these become your dose-timeline markers.
- Weigh in on fixed days (1–3 mornings a week, same conditions) so the trend line has honest inputs.
- Let the tool smooth the weight into a trend curve instead of connecting raw dots.
- Overlay the dose timeline so each titration step-up is visible under the curves.
- Review the whole chart before each clinician visit, zoomed out to weeks — never use the medication curve to self-adjust a dose.

07
How a GLP-1 tracker app plots this automatically
Drawing these curves by hand is tedious; it is exactly what an app is for. A good tracker turns your logs into a live plot:
- A weight-trend line that smooths daily noise and makes plateaus obvious.
- A dose timeline marking every titration step-up beneath your curves.
- An educational medication-level view so you understand peaks and troughs — clearly labeled as a model, not your blood level.
- Side-effect markers overlaid so you can see symptoms cluster around dose changes.
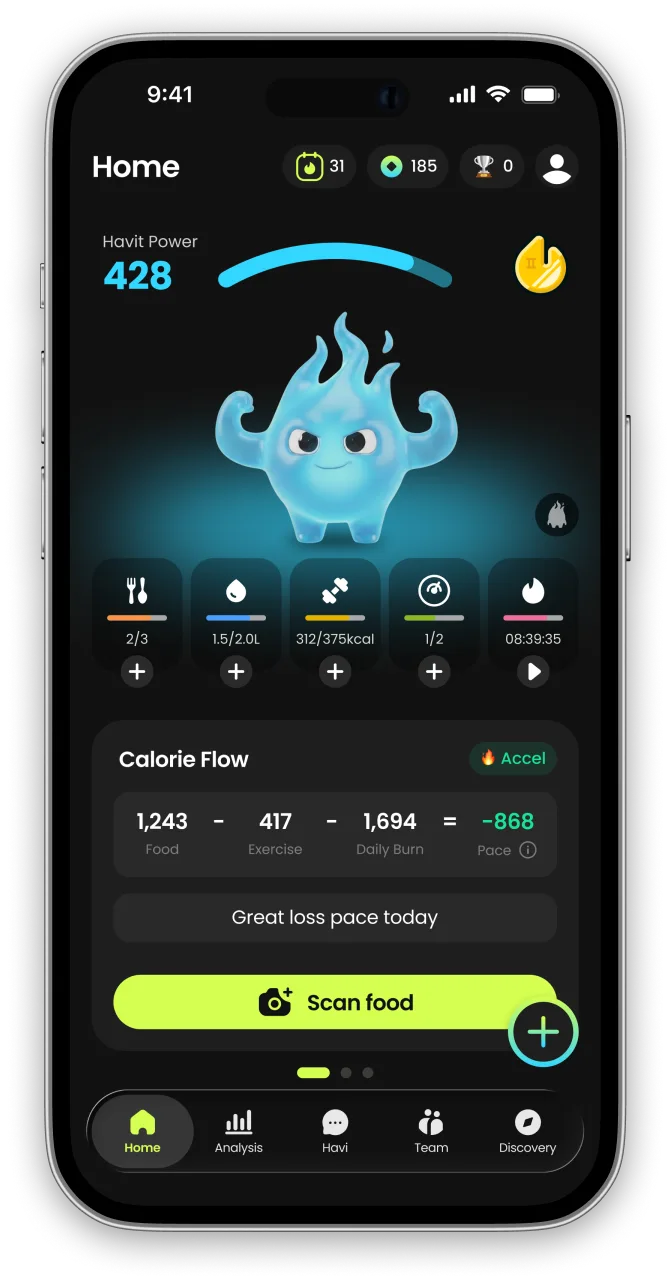
HAVIT brings your doses, weigh-ins, body-composition and habits into one wellness app and plots them together — so the numbers you log become a picture you can read and share.
If you want your data and your graphs in the same place, it is a natural home for your GLP-1 journey.
08
Why HAVIT — Medication + Behavior Change, in One App
GLP-1 medications can meaningfully reduce weight — but the number on the scale is only part of the story.
Roughly 20–40% of the weight lost on GLP-1 therapy can come from lean (muscle) tissue rather than fat (Neeland et al., Diabetes, Obesity and Metabolism, 2024), and results tend to fade once the medication stops unless new habits take their place.
That's why leading guidance treats medication as one part of care, not the whole: the U.S. Preventive Services Task Force recommends that adults with obesity be offered intensive, multicomponent behavioral interventions (USPSTF, Grade B).
HAVIT is built for exactly this moment — one app that unites medication tracking, body composition, nutrition and protein, daily habit-building, and an AI coach that adapts to you.
Across our own 1,090 GLP-1 users, the most consistent trackers built the strongest habits (see the GLP-1 habit report).
Manage the medicine and the muscle — together. Start with HAVIT →

The medication-level curve: peaks, troughs and half-life
| Medication (brand) | Elimination half-life | Peak level after a dose | Steady levels reached |
|---|---|---|---|
| Semaglutide (Ozempic, Wegovy) | ~1 week (about 7 days) | 1–3 days after the shot | after ~4–5 weeks of once-weekly dosing |
| Tirzepatide (Mounjaro, Zepbound) | ~5 days | within a few days | within a few weeks of once-weekly dosing |
Frequently asked questions
What is a GLP-1 plotter?
How is a plotter different from a progress tracker?
Can a plotter tell me my actual drug level?
What is semaglutide's half-life, and why does it matter for the graph?
Why does my weight curve go flat for weeks?
Why plot the dose timeline underneath the other curves?
How often should I weigh in for a useful trend line?
Should I change anything based on my plot?
What is Havit?
Havit is an AI health companion for weight loss that protects muscle.
Unlike calorie-only trackers, Havit connects AI body-composition estimates, nutrition, hydration, sleep, steps, cycle, mood, and GLP-1 medication in one daily routine — so progress is measured by body composition, not just the number on the scale. Daily missions turn established behavior-change techniques into small repeatable actions, drawing on expertise from professionals formerly at Juvis Diet, one of Korea’s leading metabolic clinics.
In Havit’s own analysis of 1,090 GLP-1 users, people who logged consistently built stronger habits than the general user base. Read the GLP-1 Habit Report
Havit works with or without GLP-1 medication. It is a wellness app, not a medical device; body-composition results are estimates.

Continue in the App
Personalized wellness with your own data


References
- U.S. Food & Drug Administration — OZEMPIC (semaglutide) Prescribing Information, Section 12.3 Pharmacokinetics (half-life ~1 week; peak 1–3 days). accessdata.fda.gov
- U.S. Food & Drug Administration — MOUNJARO (tirzepatide) Prescribing Information, Pharmacokinetics (half-life ~5 days). accessdata.fda.gov
- U.S. Food & Drug Administration — ZEPBOUND (tirzepatide) Prescribing Information. accessdata.fda.gov
- Furihata K. et al. — Population pharmacokinetics of the GIP/GLP-1 receptor agonist tirzepatide, *PMC*. pmc.ncbi.nlm.nih.gov
- Cleveland Clinic — GLP-1 Agonists: how they work and are dosed. my.clevelandclinic.org
- All pharmacokinetic facts above were verified against the cited FDA labels and pharmacology literature as of July 2026. Labels are updated periodically — confirm current details with your prescriber and the official prescribing information.*


