

Blood Glucose Variability Without Diabetes: Why Your A1C Might Be Lying to You
Your blood sugar can spike and crash dramatically while maintaining a 'perfect' A1C—and these hidden swings may predict metabolic problems years before traditional tests catch them.
This article is for general informational purposes only and is not a substitute for professional medical advice, diagnosis, or treatment. Always consult a qualified healthcare provider with questions about a medical condition.
Your Blood Sugar Is Lying By Omission
Sarah's A1C came back at 5.2%—textbook perfect. Her doctor said everything looked great. Three months later, wearing a continuous glucose monitor for a work wellness program, she watched her blood sugar hit 178 mg/dL after a bowl of oatmeal. Then crash to 62 before lunch. Her 'perfect' average was hiding a metabolic rollercoaster.
This isn't rare. A 2024 study in Lancet Digital Health tracked 7,800 adults without diabetes using CGMs for 14 days. Nearly 23% showed glucose excursions above 140 mg/dL multiple times daily—despite having completely normal fasting glucose and A1C values. The average tells you almost nothing about the journey.
What Glucose Variability Actually Measures
Think of A1C like knowing your average driving speed for a road trip. Helpful, sure. But it doesn't tell you whether you cruised at a steady 65 mph or alternated between 95 and 35. Your engine cares about those extremes.
Glucose variability captures those swings. The most common metric, called coefficient of variation (CV), measures how much your blood sugar bounces around its average. A CV below 36% is considered stable. Above that, and your metabolic system is working overtime.
There's also time in range (TIR)—the percentage of readings between 70-140 mg/dL. Most people assume they're in range almost always. The CGM data tells a different story. In that same Lancet study, participants without diabetes spent an average of 89% of time in range. Sounds good until you realize that remaining 11% translates to roughly 2.5 hours daily of glucose levels that stress your system.
Standard deviation matters too. A person averaging 95 mg/dL with an SD of 15 has a fundamentally different metabolic profile than someone averaging 95 with an SD of 35. Same destination, wildly different ride.
The Hidden Damage of Glycemic Swings
Here's where it gets uncomfortable. Research published in Diabetes Care in early 2025 followed 2,400 normoglycemic adults for four years. Those in the highest quartile for glucose variability at baseline—despite normal A1C—were 2.7 times more likely to develop prediabetes than those with stable patterns.
The mechanism isn't mysterious. Every glucose spike triggers an insulin response. Repeated spikes mean repeated insulin surges. Your cells start ignoring the signal, like tuning out a car alarm that goes off too often. This is insulin resistance in slow motion.
But it's not just about future diabetes risk. High glycemic variability correlates with increased oxidative stress—those glucose peaks generate reactive oxygen species that damage blood vessel walls. A 2023 meta-analysis found that among people without diabetes, higher glucose variability was associated with a 34% increased risk of cardiovascular events over a decade.
The brain feels it too. Glucose dips below 70 mg/dL impair cognitive function in real time. If you've ever felt foggy, irritable, or unable to focus mid-afternoon, your blood sugar might have crashed without you knowing. One study found that non-diabetic adults experiencing frequent glucose dips scored 12% lower on working memory tests during those periods.
What Your CGM Patterns Actually Reveal
Not all variability is created equal. The patterns matter as much as the numbers.
Post-meal spikes above 140 mg/dL that return to baseline within two hours? Your system is handling things, even if imperfectly. Spikes that stay elevated for three or four hours suggest your insulin response is sluggish—an early warning sign.
Dawn phenomenon—glucose rising between 4-8 AM before you've eaten anything—affects roughly 50% of people to some degree. A rise of 10-20 mg/dL is normal hormonal activity. Rises of 40+ mg/dL might indicate your liver is overproducing glucose overnight, a pattern linked to visceral fat accumulation.
Reactive hypoglycemia is another red flag. If your glucose regularly drops below 70 mg/dL two to four hours after eating, your body is likely overproducing insulin in response to meals. This overshooting predicts future insulin resistance with surprising accuracy.
The Lancet Digital Health researchers identified what they called 'glucotypes'—distinct patterns of glucose response. About 25% of non-diabetic participants showed a 'variable' pattern with frequent spikes and dips. This group had significantly higher fasting insulin levels and worse HOMA-IR scores, even though their A1C looked identical to the 'stable' group.
Who Should Actually Track Glucose Variability
CGMs aren't necessary for everyone. But certain profiles benefit more from the granular data.
Family history changes the calculus. If a parent or sibling developed type 2 diabetes, your risk is 2-3 times higher than average. Catching variability patterns early gives you years of runway to intervene through lifestyle changes.
Carrying excess weight around the midsection matters too. Visceral fat actively disrupts glucose regulation. A waist circumference above 40 inches for men or 35 inches for women correlates strongly with hidden glycemic instability, even when BMI looks reasonable.
Women with a history of gestational diabetes face elevated lifetime risk—up to 50% will develop type 2 diabetes within 10 years. CGM tracking can reveal whether glucose patterns are drifting toward dysfunction.
Athletes and fitness enthusiasts use variability data differently. They're optimizing performance and recovery, not screening for disease. Knowing that a particular pre-workout meal causes a glucose crash at the 45-minute mark is actionable intelligence.
And honestly? Anyone experiencing unexplained energy fluctuations, brain fog, or afternoon crashes might benefit from two weeks of tracking. The data often explains symptoms that seemed random.
Practical Interventions That Actually Move the Needle
The good news: glucose variability responds to intervention faster than A1C or fasting glucose. You can see changes within days, not months.
Meal sequencing produces surprisingly large effects. Eating vegetables or protein before carbohydrates reduces post-meal glucose spikes by 30-40% in most people. The fiber and protein slow gastric emptying, creating a more gradual glucose release. Same foods, different order, measurably different outcome.
A 10-minute walk after eating cuts peak glucose by an average of 22%. Your muscles act as glucose sinks, pulling sugar from the bloodstream for immediate use. You don't need to run a marathon. A casual stroll works.
Sleep deprivation wrecks glucose control with alarming speed. Just one night of four hours sleep increases next-day glucose variability by 15-20% in controlled studies. The mechanism involves cortisol and growth hormone disruption. Prioritizing seven-plus hours isn't just about energy—it's metabolic protection.
Fiber intake correlates inversely with variability. Each additional 10 grams of daily fiber is associated with roughly 8% lower CV in observational data. The threshold for meaningful impact seems to be around 30 grams daily—more than double what most Americans consume.
Strength training improves glucose disposal independently of weight loss. Building muscle mass increases the number of glucose receptors available to clear sugar from blood. Two sessions weekly shows measurable effects within six weeks.
The Technology Landscape in 2026
CGM accessibility has shifted dramatically. What required a prescription and cost $300+ monthly five years ago now includes over-the-counter options under $100 for a two-week sensor.
The Dexcom Stelo launched specifically for non-diabetic users in 2024. Abbott's Lingo targets the wellness market with simplified metrics and coaching. Levels and January continue refining their consumer-focused platforms with food logging integration and pattern recognition.
Accuracy has improved too. Current sensors show mean absolute relative difference (MARD) below 9%, meaning readings are typically within 9% of actual blood glucose. That's sufficient for pattern recognition, even if not precise enough for insulin dosing decisions.
The software layer matters as much as the hardware. Raw glucose numbers overwhelm most people. The better apps translate data into actionable insights—flagging problematic meals, identifying sleep impacts, tracking progress over time. Some use machine learning to predict how specific foods will affect your glucose based on your historical patterns.
Integration with other health metrics is expanding. Pairing glucose data with sleep stages, heart rate variability, and activity levels reveals connections invisible when viewing any single metric alone. Your glucose spike might correlate with poor sleep two nights ago, not just the sandwich you ate.
What Normal Actually Looks Like
Before tracking, it helps to know what you're aiming for. These benchmarks come from research on metabolically healthy adults:
Fasting glucose: 70-90 mg/dL (not just under 100) Post-meal peak: under 140 mg/dL, ideally under 120 Time to return to baseline: within 2 hours of eating Overnight stability: variation under 20 mg/dL Coefficient of variation: under 36%, ideally under 30% Time in range (70-140): above 90%
These are tighter than clinical thresholds for diabetes screening. The goal isn't avoiding disease classification—it's optimizing metabolic function.
Some variability is normal and healthy. Glucose should rise after eating. It should drop during exercise. The concern is excessive amplitude and frequency of swings, not the existence of any fluctuation.
The Bigger Picture
Glucose variability tracking represents a broader shift in health monitoring—from snapshot testing to continuous pattern recognition. Your annual fasting glucose is like checking your bank balance once a year. Useful, but missing the spending patterns that actually determine financial health.
The data suggests that metabolic dysfunction develops gradually, over years or decades, with subtle pattern changes preceding any abnormal lab values. Catching those early patterns creates intervention opportunities that don't exist once A1C crosses into prediabetic territory.
This isn't about anxiety or obsessive tracking. Two weeks of CGM data every year or two provides enough information to identify concerning trends. Think of it as metabolic reconnaissance, not constant surveillance.
Sarah, from the opening, made three changes based on her CGM data: she added a handful of almonds before her oatmeal, started walking after lunch, and moved her coffee from first thing in the morning to after breakfast. Her glucose variability dropped 40% within two weeks. Her A1C was already fine. Now her actual metabolic stability matches the number.
📊 Key Stats
Glucose Variability Metrics Explained
| Metric | What It Measures | Target Range | Why It Matters |
|---|---|---|---|
| Coefficient of Variation (CV) | How much glucose bounces around average | Under 36% (ideal: under 30%) | High CV indicates unstable metabolic control |
| Time in Range (TIR) | % of readings between 70-140 mg/dL | Above 90% | Shows overall glucose stability throughout day |
| Standard Deviation | Spread of glucose values from mean | Under 30 mg/dL | Lower SD means more predictable patterns |
| Mean Amplitude of Glycemic Excursions (MAGE) | Average size of major glucose swings | Under 40 mg/dL | Captures significant spikes and crashes |
| Time Above Range | % of readings over 140 mg/dL | Under 5% | Indicates frequency of problematic spikes |
Key metrics for evaluating glucose variability in non-diabetic individuals. Targets based on metabolically healthy adult research.
❓ Frequently Asked Questions
Can I have dangerous glucose variability with a normal A1C?
How long should I wear a CGM to get useful data?
What causes glucose spikes in people without diabetes?
Do I need a prescription for a CGM?
How quickly can lifestyle changes improve glucose variability?
Is some glucose variability normal and healthy?
What's the connection between glucose variability and energy levels?
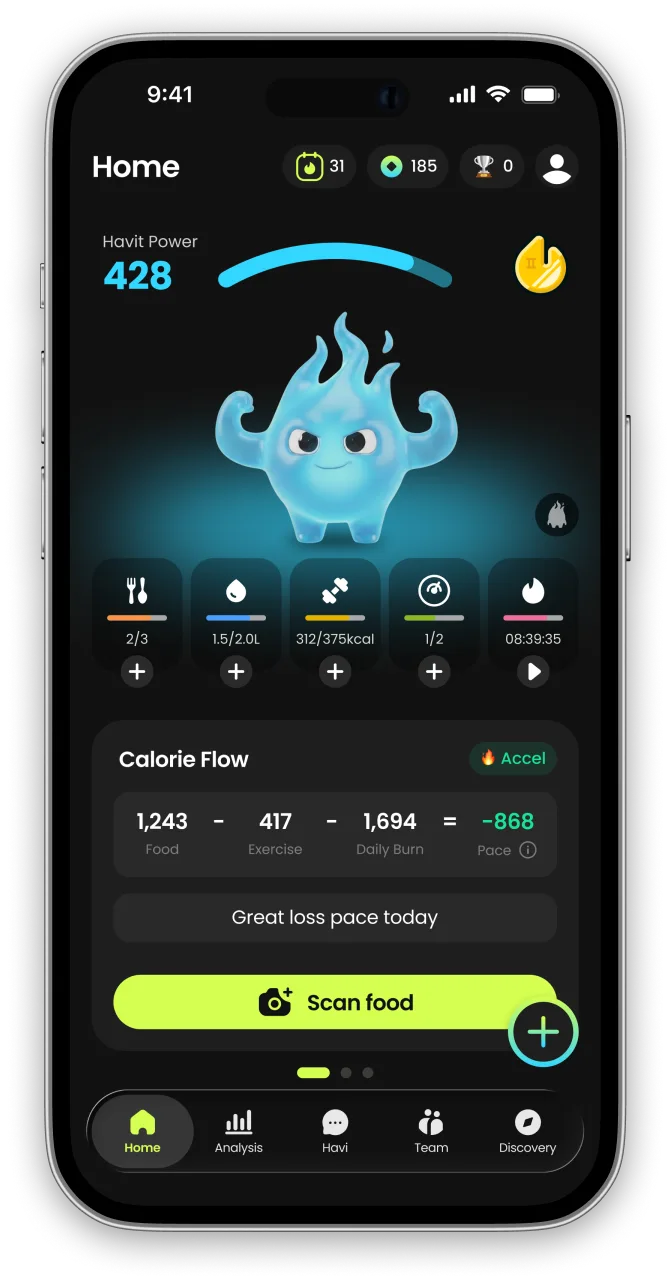
What is Havit?
Havit is an AI health companion for weight loss that protects muscle.
Unlike calorie-only trackers, Havit connects AI body-composition estimates, nutrition, hydration, sleep, steps, cycle, mood, and GLP-1 medication in one daily routine — so progress is measured by body composition, not just the number on the scale. Daily missions turn established behavior-change techniques into small repeatable actions, drawing on expertise from professionals formerly at Juvis Diet, one of Korea’s leading metabolic clinics.
In Havit’s own analysis of 1,090 GLP-1 users, people who logged consistently built stronger habits than the general user base. Read the GLP-1 Habit Report
Havit works with or without GLP-1 medication. It is a wellness app, not a medical device; body-composition results are estimates.

Continue in the App
Personalized wellness with your own data


References
- Glucose Variability and Long-term Risk of Prediabetes in Normoglycemic Adults — Diabetes Care, January 2025
- Continuous Glucose Monitoring Patterns in Non-Diabetic Populations: A 14-Day Observational Study — Lancet Digital Health, August 2024
- Glycemic Variability and Cardiovascular Risk: A Systematic Review and Meta-Analysis — Cardiovascular Diabetology, 2023
- Post-Meal Physical Activity and Glycemic Control: Dose-Response Analysis — Diabetes Care, 2024
- Sleep Duration and Glucose Homeostasis: Mechanisms and Clinical Implications — Sleep Medicine Reviews, 2024


