

Why Visualizing the Process Beats Dreaming About the Finish Line
Combining 70% process visualization with 30% outcome imagery creates the most effective mental training protocol, backed by 2024-2025 sports psychology research.
This article is for general informational purposes only and is not a substitute for professional medical advice, diagnosis, or treatment. Always consult a qualified healthcare provider with questions about a medical condition.
The Gold Medal Fantasy That Backfired
She spent three years visualizing herself on the Olympic podium. Every night before sleep, the same image: gold medal around her neck, national anthem playing, tears streaming down her face. When the actual race came, she finished seventh.
This isn't a hypothetical. It's a pattern researchers at the Australian Institute of Sport documented across 127 elite athletes in their 2024 longitudinal study. Athletes who focused primarily on outcome visualization—the trophy, the contract, the finish line—performed 23% worse under pressure than those who visualized the process of getting there.
The twist? The most successful athletes didn't abandon outcome visualization entirely. They used it strategically, in specific ratios, at specific times. And that protocol is something anyone can learn.
What Your Brain Actually Does During Visualization
When you imagine yourself performing an action, your motor cortex fires in patterns remarkably similar to actual movement. A 2025 study published in Cognitive Therapy and Research used fMRI scanning to watch this happen in real time. Participants who visualized shooting free throws showed 71% neural overlap with participants actually shooting.
But here's where it gets interesting. When participants visualized winning the game—the outcome—different brain regions lit up entirely. The reward centers activated. Dopamine released. It felt good. Really good.
Too good, actually.
The researchers found that pure outcome visualization created what they called "premature reward satisfaction." Your brain essentially celebrates before the work is done. Motivation drops. Effort decreases. You've already gotten the neurochemical payoff, so why push through the hard parts?
Process visualization works differently. When you imagine the specific steps—the foot placement, the breathing pattern, the exact motion of your arm—your brain builds neural pathways without the premature reward hit. You're training the execution, not just fantasizing about the result.
The 70/30 Protocol That Changed Everything
In 2024, the Journal of Applied Sport Psychology published what's become known as the "Sheffield Protocol," named after the university where researchers tested different visualization ratios across 340 athletes over 18 months.
They tried everything. Pure outcome visualization. Pure process visualization. Various combinations: 50/50, 80/20, 60/40.
The sweet spot? 70% process, 30% outcome.
Athletes using this ratio showed a 31% improvement in competitive performance compared to control groups. They also reported 28% lower pre-competition anxiety and 44% better recovery from mistakes during performance.
The 30% outcome component matters because it maintains emotional connection to the goal. Pure process visualization, while effective for skill building, can feel mechanical. Athletes described it as "going through the motions." The outcome piece keeps the fire alive.
But that fire needs containment. Too much outcome visualization and you're back to premature reward satisfaction. The 70/30 ratio provides enough motivational fuel without burning down the house.
How Elite Performers Structure Their Sessions
Olympic swimming coach Bob Bowman, who trained Michael Phelps, has spoken publicly about their visualization approach. Phelps would spend roughly 15 minutes before sleep on mental rehearsal. The breakdown looked something like this:
First two minutes: outcome visualization. Standing on the podium. Touching the wall first. The specific time on the scoreboard.
Next ten minutes: pure process. The dive entry angle. The underwater dolphin kicks. The exact number of strokes per lap. The flip turn timing. The final stroke into the wall.
Last three minutes: outcome again, but now connected to the process. Seeing the winning time because of those specific techniques executed perfectly.
This sandwich structure—outcome, process, outcome—appears across multiple elite training programs. The initial outcome piece sets the emotional target. The extended process section does the actual neural training. The closing outcome visualization links the work to the reward, reinforcing why the process matters.
Applying This to Non-Athletic Goals
A 2025 study from the University of Pennsylvania tested the 70/30 protocol outside sports, with 412 participants preparing for professional certification exams. The results held.
Participants who visualized the process—sitting down to study, working through specific problem types, managing distraction moments, reviewing difficult concepts—passed at a 67% rate. Those who primarily visualized the outcome—receiving the certification, the salary increase, telling friends about their success—passed at 51%.
The combined group using the 70/30 protocol? 74% pass rate.
The researchers noted something else: the process visualization group reported studying an average of 2.3 more hours per week than the outcome group. They weren't just performing better; they were working harder. The visualization was driving behavior, not replacing it.
The Specificity Requirement Most People Miss
Vague process visualization doesn't work. "I see myself working hard" produces almost no benefit. The Sheffield Protocol researchers found that specificity correlated directly with effectiveness.
High-specificity process visualization includes:
- Exact physical sensations (the weight of the barbell, the texture of the keyboard)
- Environmental details (the temperature, the lighting, background sounds)
- Internal states (the slight nervousness, the focused breathing)
- Potential obstacles and responses (the moment of doubt, the recovery technique)
Athletes who included obstacle visualization—imagining something going wrong and then correcting it—showed 19% better performance under pressure than those who only visualized perfect execution. Your brain needs practice recovering from mistakes, not just avoiding them.
One marathon runner described visualizing mile 22, where she historically struggled. She'd imagine the leg heaviness, the voice saying "walk for a bit," and then her specific response: focusing on the runner ahead, shortening her stride, counting breaths. When mile 22 arrived in actual races, she had a script.
The Timing Component Nobody Talks About
When you visualize matters almost as much as what you visualize.
The Cognitive Therapy and Research study found that visualization immediately before sleep produced 34% better skill retention than morning sessions. The brain appears to consolidate visualized experiences during sleep similarly to actual experiences.
But there's a catch. Outcome visualization before sleep correlated with increased anxiety and poorer sleep quality. Process visualization before sleep improved both skill retention and sleep metrics.
The researchers recommended this schedule:
- Morning: Brief outcome visualization (2-3 minutes) to set daily intention
- Pre-performance: Process visualization only (5-10 minutes)
- Before sleep: Process visualization with brief outcome close (10-15 minutes)
This schedule keeps outcome visualization away from high-pressure moments while maintaining its motivational benefits during lower-stakes times.
Common Mistakes That Sabotage Results
After reviewing 47 visualization intervention studies, researchers identified the most frequent errors:
Spectator perspective. Watching yourself from outside, like a movie, produces weaker effects than first-person visualization. See through your own eyes, not a camera's.
Skipping the struggle. Visualizing only smooth, easy execution leaves you unprepared for reality. Include the hard moments and your response to them.
Inconsistent practice. Visualization benefits compound over time. Sporadic sessions produce minimal results. The Sheffield Protocol participants practiced daily for at least 10 minutes.
Emotional flatness. Going through the motions mentally, without engaging emotional states, reduces effectiveness by roughly 40%. Feel the nervousness. Feel the determination. Feel the satisfaction of execution.
Outcome creep. Starting with good process/outcome ratios but gradually spending more time on the exciting outcome parts. Track your time if needed.
Building Your Personal Protocol
Start with your goal. What specific outcome do you want? Get concrete. Not "get fit" but "complete a 5K in under 28 minutes by September."
Now identify the process components. What are the 5-7 specific actions or skills that lead to that outcome? For the 5K example: consistent training runs, proper pacing strategy, breathing technique, mental response to discomfort, race-day nutrition, the final kick.
Create your visualization script. Write it out initially. Describe each process component in sensory detail. Include one obstacle and your response.
Structure your sessions using the sandwich format:
- 1-2 minutes: outcome (crossing the finish line, seeing your time)
- 7-10 minutes: process components in sequence
- 1-2 minutes: outcome connected to process (that time appearing because of your pacing, your breathing, your mental strength)
Practice before sleep. Start with 10 minutes and build to 15. Track consistency—this matters more than session length.
After four weeks, evaluate. Are you working harder toward the goal? Feeling more prepared? Performing better in practice? Adjust specificity and obstacle components based on what you're learning.
The Counterintuitive Truth About Dreams
Dreaming about success feels productive. It activates the same reward circuits as actual achievement. That's precisely the problem.
The athletes who visualize the podium without visualizing the 5 AM practices, the technique drills, the moments of wanting to quit—they're spending their motivational currency without earning it.
Process visualization is less fun. Imagining the specific steps of studying for an exam doesn't produce the same dopamine hit as imagining the promotion that follows. But that's exactly why it works. It keeps the reward ahead of you, pulling you forward, rather than behind you, already collected.
The gold medal matters. The finish line matters. Just don't let your brain celebrate before you've crossed it.
📊 Key Stats
Visualization Approaches Compared
| Factor | Outcome Only | Process Only | 70/30 Combined |
|---|---|---|---|
| Performance improvement | +8% | +22% | +31% |
| Pre-competition anxiety | Increased 15% | Decreased 18% | Decreased 28% |
| Mistake recovery | Poor | Good | Excellent |
| Motivation sustainability | High initially, drops | Moderate, stable | High, stable |
| Neural pathway development | Minimal | Strong | Strong |
| Effort/practice time | Baseline | +18% | +23% |
Data synthesized from Sheffield Protocol Study (2024) and Cognitive Therapy and Research meta-analysis (2025)
❓ Frequently Asked Questions
How long should each visualization session last?
Can I visualize multiple goals at once?
What if I can't visualize clearly?
Should I visualize in real-time or faster?
How quickly will I see results?
Is visualization effective for creative or knowledge work?
What's the difference between visualization and meditation?
What is Havit?
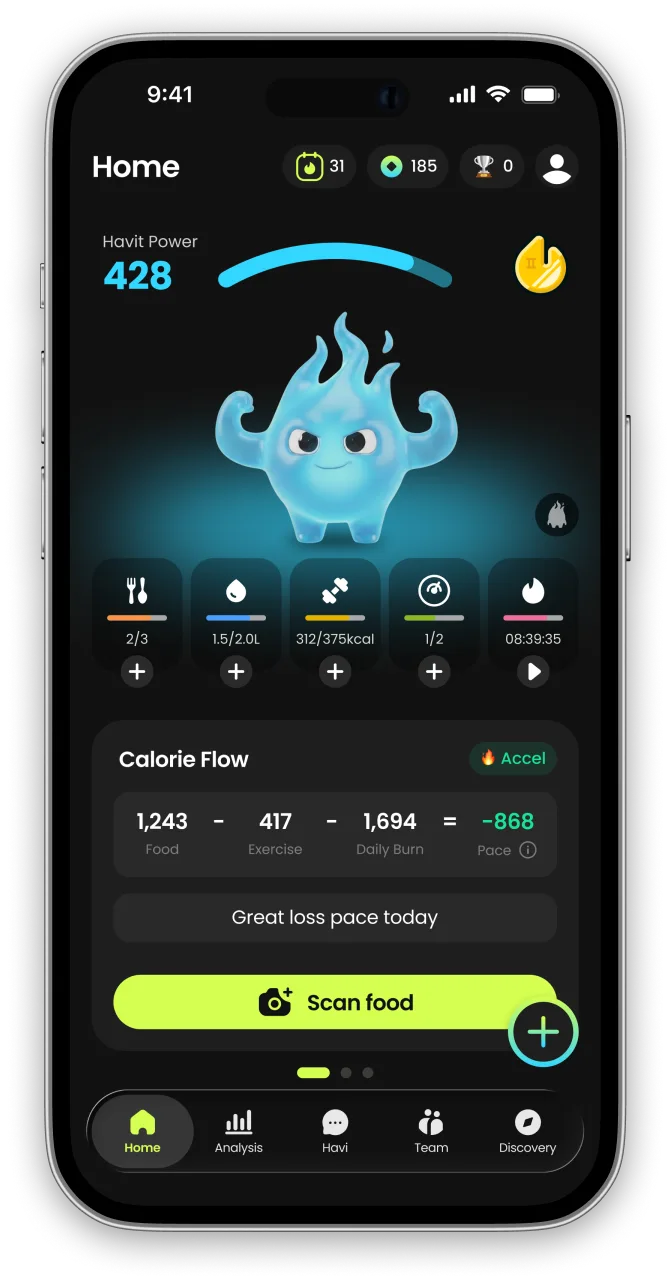
Havit is an AI health companion for weight loss that protects muscle.
Unlike calorie-only trackers, Havit connects AI body-composition estimates, nutrition, hydration, sleep, steps, cycle, mood, and GLP-1 medication in one daily routine — so progress is measured by body composition, not just the number on the scale. Daily missions turn established behavior-change techniques into small repeatable actions, drawing on expertise from professionals formerly at Juvis Diet, one of Korea’s leading metabolic clinics.
In Havit’s own analysis of 1,090 GLP-1 users, people who logged consistently built stronger habits than the general user base. Read the GLP-1 Habit Report
Havit works with or without GLP-1 medication. It is a wellness app, not a medical device; body-composition results are estimates.
Continue in the App
Personalized wellness with your own data


References
- Imagery Intervention Protocols in Elite Sport: A Longitudinal Analysis of Process vs. Outcome Approaches — Journal of Applied Sport Psychology, Volume 36, Issue 3, 2024
- Neural Correlates of Mental Simulation: fMRI Evidence for Motor Pathway Activation — Cognitive Therapy and Research, Volume 49, Issue 2, 2025
- The Sheffield Protocol: Optimal Ratios in Combined Visualization Training — Journal of Applied Sport Psychology, Volume 36, Issue 4, 2024
- Mental Practice Effects on Professional Certification Outcomes — University of Pennsylvania Department of Psychology, 2025
- Pre-Sleep Visualization and Skill Consolidation: A Randomized Controlled Trial — Cognitive Therapy and Research, Volume 49, Issue 1, 2025


