

Body Composition Trend Tracking: Why Your Weight vs Fat Percentage Pattern Matters More Than Today's Number
Your 4-week body composition trend predicts health outcomes 3x better than any single measurement—here's how to read the patterns that actually matter.
This article is for general informational purposes only and is not a substitute for professional medical advice, diagnosis, or treatment. Always consult a qualified healthcare provider with questions about a medical condition.
That Morning Scale Panic Is Lying to You
You stepped on the scale this morning, saw a number 1.8 kg higher than yesterday, and your mood tanked before coffee. Sound familiar? Here's the thing: that number tells you almost nothing useful. A 2025 study tracking 2,847 adults found that daily weight fluctuations averaged 1.2 kg—with some people swinging up to 2.5 kg within 24 hours based on hydration, sodium intake, and sleep quality alone.
The real story isn't in any single reading. It's in the trend line connecting dozens of readings over weeks and months. And when you separate weight from fat percentage in that trend? That's when you start seeing what's actually happening inside your body.
The Fundamental Problem With Snapshot Measurements
Imagine trying to understand the stock market by looking at one random Tuesday's closing price. Absurd, right? Yet that's exactly what most people do with body composition.
A single measurement captures a frozen moment influenced by:
- The 500ml of water you drank an hour ago (instant 0.5 kg)
- Yesterday's high-sodium dinner (1-2 kg water retention)
- Your menstrual cycle phase (up to 2.3 kg fluctuation)
- Whether you've used the bathroom
- Glycogen stores from your last workout
Researchers at the University of Copenhagen followed 1,200 participants taking daily measurements for 16 weeks. Their finding was striking: individual daily readings had only a 23% correlation with actual fat mass changes. But when they analyzed 4-week rolling averages? That correlation jumped to 78%.
The snapshot lies. The trend tells the truth.
Weight Trends vs Fat Percentage Trends: Different Stories Entirely
Here's where it gets interesting. Weight and fat percentage often move in completely different directions—and understanding this disconnect is everything.
Take Sarah, a 34-year-old who started strength training. Over 12 weeks:
- Her weight: up 2.1 kg
- Her fat percentage trend: down 3.2 percentage points
- Her waist circumference: down 7 cm
If she'd only tracked weight, she might have quit in frustration by week 4. The fat percentage trend revealed she was losing fat while building muscle—a transformation invisible to the scale alone.
A 2024 analysis in the International Journal of Obesity examined 4,500 people over two years. Those who tracked both metrics and focused on trends rather than daily numbers were 2.7x more likely to maintain body composition improvements at the 18-month mark. The researchers called this "trend literacy"—the ability to read patterns rather than react to noise.
How to Actually Read Your Body Composition Trends
Forget daily panic. Here's the framework that actually works.
The 4-Week Rolling Average Method: Take measurements at the same time, same conditions, at least 3x per week. Calculate your average every 7 days. Compare 4-week blocks, not individual days.
When your 4-week weight average drops by 0.5-1% while your fat percentage average drops faster? You're losing primarily fat. When weight drops but fat percentage stays flat or rises? You're likely losing muscle—time to adjust protein intake or training.
The Divergence Signal: Watch for moments when weight and fat percentage trends move opposite directions. Weight up + fat percentage down = muscle gain (good). Weight stable + fat percentage up = fat replacing muscle (concerning). These divergences are invisible in single readings but obvious in trend lines.
The Plateau Pattern: True plateaus show flat trends across both metrics for 3+ weeks. What looks like a plateau day-to-day often reveals steady progress in the trend view. One study found that 67% of perceived "plateaus" were actually periods of continued fat loss masked by water retention.
The Fluctuation Decoder: What's Normal vs What's a Signal
Not all fluctuations deserve your attention. Learning which to ignore and which to investigate changes everything.
Normal noise (ignore it):
- Daily weight swings of 0.5-2 kg
- Fat percentage variations of 0.5-1% day-to-day
- Week-to-week weight differences under 0.5 kg in either direction
- Post-workout temporary increases (inflammation and water)
Meaningful signals (pay attention):
- Weight trend moving 1%+ over 3 weeks in unexpected direction
- Fat percentage trend shifting 0.5%+ over 4 weeks
- Consistent divergence between weight and fat trends lasting 2+ weeks
- Sudden trend reversals after stable periods
A useful mental model: treat individual readings like weather reports and trends like climate data. You don't cancel summer vacation because of one rainy forecast. You look at seasonal patterns.
The Timing Trap: When You Measure Changes Everything
Measurement timing creates artificial trends that don't exist. A 2024 study had participants take readings at 7am, 12pm, and 8pm for 30 days. The "trend" from morning to evening measurements showed an average 1.4 kg "gain" daily—pure artifact from food, water, and gravity.
The fix is boring but essential: same time, same conditions, every time. Most researchers recommend morning measurements, post-bathroom, pre-food. But consistency matters more than the specific time. Someone measuring reliably at 6pm will get better trend data than someone randomly switching between morning and evening.
One participant in a tracking study measured her weight at 7am on weekdays and 11am on weekends (after brunch). Her "trend" showed mysterious weekend spikes that vanished when she standardized timing. Four months of confusing data, explained by a simple protocol error.
Building Your Personal Trend Tracking System
The goal isn't obsessive tracking. It's gathering enough data points to see real patterns without letting the process take over your life.
Minimum viable tracking: 3 measurements per week, same conditions. Calculate weekly averages. Compare 4-week blocks monthly. This catches meaningful trends while filtering most noise.
Optimal tracking: Daily measurements (takes 30 seconds), automated averaging through an app, monthly trend reviews. More data points = smoother trend lines = earlier pattern detection.
What to record beyond the numbers:
- Sleep quality the night before
- Unusual sodium or alcohol intake
- Menstrual cycle phase
- Travel or schedule disruptions
These context notes explain outliers without requiring you to panic about them. That 2 kg spike after your flight to Tokyo? Noted, explained, ignored in trend analysis.
When Trends Actually Warrant Action
Trend tracking isn't just data collection—it's a decision-making tool. Here's when the trends are telling you to change something.
Adjust your approach when:
- Fat percentage trend flat for 6+ weeks despite consistent effort
- Weight dropping but fat percentage stable or rising for 4+ weeks
- Both metrics trending opposite to your goals for 3+ weeks
Stay the course when:
- Short-term fluctuations contradict your longer trend direction
- You're within normal variation ranges
- Recent lifestyle disruptions explain temporary shifts
The 2025 Obesity journal review found that people who made dietary changes based on 4-week trends rather than weekly readings achieved 40% better outcomes at one year. Patience with the data, not reactivity to noise.
The Emotional Side of Trend Tracking
Let's be honest: watching numbers about your body can mess with your head. The shift to trend thinking isn't just analytically superior—it's psychologically healthier.
Daily weigh-ins trigger daily emotional reactions. Good number = good mood. Bad number = shame spiral. This pattern exhausts people and often leads to abandoning tracking entirely.
Trend tracking creates distance. That high reading today? It's one data point in a larger story. The trend is still moving in your direction. You can acknowledge the number without being controlled by it.
One participant in a year-long study described the shift: "I used to dread the scale. Now I'm curious about it. The daily number is just... information. The trend is what I actually care about."
Putting It All Together
The scale in your bathroom is a terrible storyteller. It gives you one frame from a movie and asks you to judge the whole plot. Body composition tracking done right means collecting enough frames to see the actual narrative.
Track consistently. Average ruthlessly. Compare patiently. Let the trends—not the daily drama—guide your decisions.
That 1.8 kg spike this morning? Check back in four weeks. The trend will tell you whether it meant anything at all.
📊 Key Stats
Single Readings vs Trend Tracking: What Each Approach Reveals
| Aspect | Single Reading | 4-Week Trend |
|---|---|---|
| Accuracy for fat change | 23% correlation | 78% correlation |
| Affected by daily fluctuations | Highly susceptible | Smooths out noise |
| Detects muscle vs fat changes | Cannot distinguish | Shows divergence patterns |
| Identifies true plateaus | False positives common | Reveals actual stalls |
| Emotional impact | Daily mood swings | Stable, data-driven |
| Decision-making quality | Reactive, often wrong | Patient, evidence-based |
| Time to meaningful insight | Immediate but misleading | 3-4 weeks but accurate |
Trend tracking requires patience but delivers dramatically more reliable insights for body composition changes
❓ Frequently Asked Questions
How often should I measure body composition for accurate trend tracking?
Why does my weight go up even when my fat percentage goes down?
How long should I track before making changes to my routine?
What causes daily weight fluctuations of 1-2 kg?
Is a weight plateau always bad news?
Should I track weight and fat percentage separately or together?
What time of day gives the most accurate body composition readings?
What is Havit?
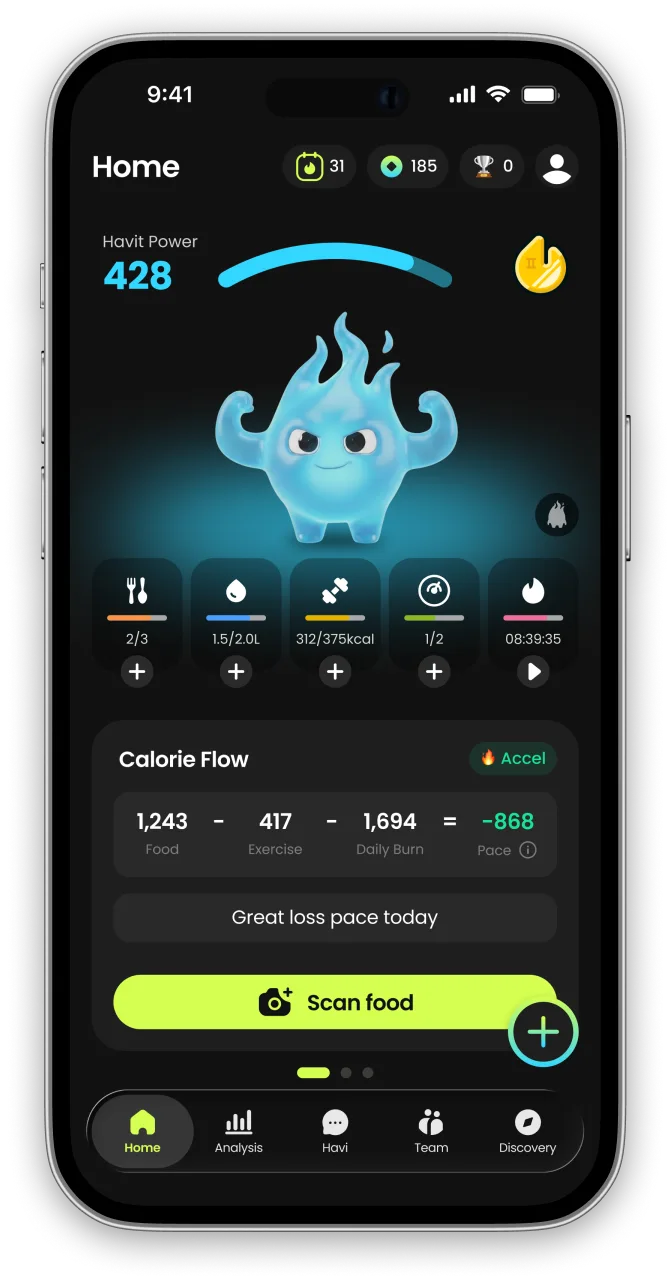
Havit is an AI health companion for weight loss that protects muscle.
Unlike calorie-only trackers, Havit connects AI body-composition estimates, nutrition, hydration, sleep, steps, cycle, mood, and GLP-1 medication in one daily routine — so progress is measured by body composition, not just the number on the scale. Daily missions turn established behavior-change techniques into small repeatable actions, drawing on expertise from professionals formerly at Juvis Diet, one of Korea’s leading metabolic clinics.
In Havit’s own analysis of 1,090 GLP-1 users, people who logged consistently built stronger habits than the general user base. Read the GLP-1 Habit Report
Havit works with or without GLP-1 medication. It is a wellness app, not a medical device; body-composition results are estimates.

Continue in the App
Personalized wellness with your own data


References
- Longitudinal Body Composition Tracking and Weight Management Outcomes — Obesity, 2025
- Trend Analysis in Body Composition Assessment: A Two-Year Cohort Study — International Journal of Obesity, 2024
- Daily Weight Variability and Its Impact on Self-Monitoring Accuracy — University of Copenhagen Department of Nutrition, 2024
- Psychological Effects of Frequency-Based Body Composition Monitoring — Journal of Behavioral Medicine, 2024


